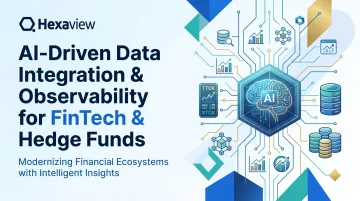
Introduction
At 9:45 a.m. on a busy trading day, a hedge fund's risk model triggers an urgent position alert—value-at-risk thresholds breached across the derivatives portfolio. The trading desk scrambles, only to discover 30 minutes later that the alarm was based on stale market data from an overnight feed failure. By the time the system catches up, genuine market moves have already exposed the fund to millions in unhedged risk.
This scenario plays out with alarming frequency across financial services. Whether it's a broken compliance report halting regulatory submissions because an upstream data pipeline missed a schema change, or a wealth management firm's client-facing dashboard showing incorrect portfolio values due to a custodian feed outage, the consequences extend far beyond IT headaches—they represent business-critical failures that can trigger regulatory penalties, client attrition, and material financial losses.
Financial institutions now manage data from dozens of disparate sources: real-time market feeds from Bloomberg and Refinitiv, trade execution data from OMS/EMS platforms, alternative data from satellite imagery and social sentiment providers, and custodian or prime broker position files. Traditional batch ETL and manual monitoring can't keep pace with this volume or complexity.
AI-driven data integration and observability address this directly — automating ingestion, transformation, and continuous pipeline monitoring so firms can trust the data behind their trading decisions, risk models, and compliance reports.
Key Takeaways
- AI-driven integration automates financial data ingestion across dozens of sources in real time, replacing brittle manual ETL
- Data observability continuously monitors pipelines, catching anomalies, stale feeds, and schema changes before they affect decisions
- Financial firms face unique pressures: high-frequency volumes, zero error tolerance, and mandates from SEC, FINRA, and MiFID II
- Key capabilities to prioritize: real-time anomaly detection, end-to-end lineage, AI root-cause analysis, and compliance-ready audit trails
The Hidden Data Crisis Inside FinTech and Hedge Funds
A single trading desk today might process intraday tick data, fixed income feeds, derivatives valuations, FX rates, satellite imagery of retail parking lots, social media sentiment scores, and ESG ratings—all within the same analytical environment, within milliseconds of each other.
The alternative data market has grown to over $15 billion as of 2025, with spending up 34% in 2024. Volume alone isn't the problem. It's what happens when any piece of that data breaks.
Data failures in financial services carry consequences unlike any other industry. A stale price feed can misprice derivatives positions, generating millions in losses before traders catch the error. A broken reconciliation pipeline doesn't just delay a report—it triggers compliance breaches and regulatory scrutiny. A missing field in a risk model skews value-at-risk calculations, leaving the firm exposed to risks it believes are fully hedged.
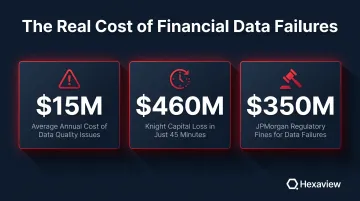
Data quality issues cost financial institutions an average of $15 million annually, according to industry research. The real-world examples prove the point: Knight Capital Group suffered a $460 million trading loss in 45 minutes when obsolete code activated during a software deployment, executing 4 million erroneous trades. JPMorgan Chase paid approximately $350 million in regulatory fines for incomplete trading data capture that undermined surveillance systems.
Both failures trace back to the same root cause: architecture built for a different era. Legacy pipelines running scheduled batch ETL were designed around end-of-day settlement files, overnight reconciliations, and next-morning reports.
Today's data stack is something else entirely — real-time feeds, petabyte-scale cloud data lakes, AI/ML models consuming streaming signals to generate alpha. Scheduled batch jobs and threshold-based alerts cannot detect the subtle anomalies, schema drift, or feed latency issues that surface in these environments. Financial firms need a different approach to integration and observability altogether.
What Is AI-Driven Data Integration and How It Works for Financial Firms
AI data integration uses machine learning to automate the extraction, transformation, routing, and reconciliation of data across heterogeneous financial sources—moving beyond static, rule-based ETL pipelines that require manual coding for every data format variation or schema change.
Traditional ETL relies on hard-coded transformation rules: if a source system renames a field from "ticker_symbol" to "security_id," the pipeline breaks until a data engineer manually updates the mapping logic. AI-driven pipelines take a different approach.
Machine learning models handle the adaptation automatically:
- Infer schema mappings by analyzing data patterns rather than relying on predefined rules
- Detect and correct format inconsistencies without manual intervention
- Classify data fields based on content, not labels
- Self-heal when vendor market data feeds push schema updates with minimal warning
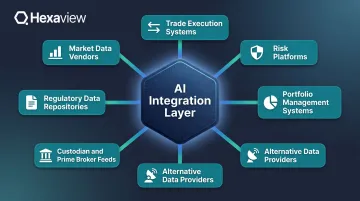
The Financial Data Sources AI Integration Must Unify
Financial institutions must integrate data from an extraordinarily diverse set of sources:
- Market data vendors (Bloomberg Terminal feeds, Refinitiv Eikon, ICE Data Services) providing real-time pricing, historical data, and analytics
- Trade execution systems including Order Management Systems (OMS) and Execution Management Systems (EMS) that track order flow and fills
- Risk platforms calculating value-at-risk, stress tests, and exposure analytics
- Portfolio management systems tracking positions, performance attribution, and rebalancing decisions
- Alternative data providers delivering satellite imagery, credit card transaction volumes, web scraping results, and social sentiment scores
- Custodian and prime broker feeds with position files, cash balances, corporate actions, and settlement data
- Regulatory data repositories for transaction reporting, large position disclosures, and audit trails
This integration challenge extends far beyond standard database connectors. Market data arrives in proprietary binary formats, custodian files use inconsistent naming conventions across counterparties, and alternative data comes in semi-structured or completely unstructured formats requiring intelligent parsing before it can be analyzed.
Real-Time vs. Batch: The Shift to Event-Driven Architectures
While 83% of banks want real-time analytics capabilities, 70% of IT processes still run in batch mode, creating a fundamental gap between aspiration and reality. The shift to event-driven architectures addresses this directly. Instead of overnight batch runs that process trade files at 2 a.m., AI-driven streaming pipelines ingest tick data, order flow, and news sentiment in milliseconds.
The business impact is immediate:
- Faster alpha signal generation — alternative data signals reach portfolio managers within seconds of availability rather than the next trading day
- Real-time risk monitoring — position exposure updates continuously as trades execute, not at end-of-day settlement
- Intraday NAV calculations — mutual funds and ETFs can track net asset values throughout the trading session for better liquidity management
Gartner predicts that by 2027, AI assistants and AI-enhanced workflows within data integration tools will reduce manual effort by 60%, enabling self-service data management for business users who currently wait days for data engineering teams to build custom pipelines.
AI-Powered Data Reconciliation
One of the most labor-intensive tasks in financial operations is reconciling positions, cash balances, and trades across counterparties. Manual data reconciliation costs financial services organizations an average of $142,790 annually due to wasted resources and inefficiencies, with 17% of organizations still relying wholly on manual processes.
AI models automate break detection by comparing expected vs. actual values across multiple data sources, classify the root cause of discrepancies (timing differences, corporate action processing, fee calculations, FX conversion errors), and accelerate resolution by routing breaks to the appropriate operations team with contextual details. Financial firms implementing AI-powered reconciliation reclaim thousands of analyst hours from manual validation work—time that shifts directly into portfolio analysis, client service, and risk oversight.
AI Data Observability: The Financial Firm's Early Warning System
Data observability in financial services means the continuous, automated ability to monitor the health, freshness, accuracy, and completeness of financial data across the entire pipeline — from source ingestion to downstream consumption in risk models, trading dashboards, and regulatory reports.
This represents a fundamental shift from traditional monitoring. Legacy tools rely on reactive, threshold-based alerts: "Send an alert if daily trade count drops below 10,000." These static rules generate massive false positive rates — markets close on holidays, trading volume varies by asset class — while missing genuine anomalies that fall within historical ranges.
Modern observability takes a proactive, ML-driven approach. Machine learning models learn the normal behavior of each data feed, including intraday seasonality, volume spikes around market open and close, and typical value distributions. Alerts fire only when something genuinely abnormal occurs, sharply reducing alert fatigue while improving detection accuracy.
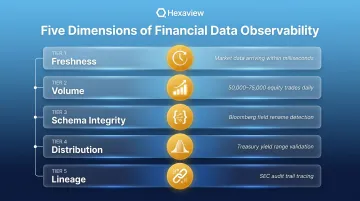
Five Dimensions of Financial Data Observability
Freshness: Is market data arriving on schedule? For a real-time equity pricing feed, freshness might be measured in seconds or milliseconds. For overnight custodian position files, freshness means arrival by 6:00 a.m. Eastern before risk reports run. Observability platforms automatically track arrival times, detect late-arriving feeds, and alert before downstream processes fail.
Volume: Are trade record counts within expected ranges? If a trading desk normally executes 50,000-75,000 equity trades daily, receiving only 5,000 trades by 2 p.m. signals a probable feed failure or system issue requiring immediate investigation.
Schema integrity: Did a vendor change a field name or data type? When Bloomberg renames "px_last" to "last_price" in an overnight schema update, traditional pipelines break silently. Observability platforms detect schema drift automatically and either adapt transformations dynamically or route alerts to data engineers.
Distribution: Have value ranges shifted unexpectedly? Suddenly seeing negative yields in a Treasury bond pricing feed, equity prices exceeding historical ranges by 10x, or foreign exchange rates that don't match published market rates all indicate data corruption or feed errors that could propagate into risk calculations.
Lineage: Can every data point in a risk report be traced back to its source? In regulated environments, it's not enough to know a number is wrong. Firms must trace exactly where it originated, what transformations it passed through, and who consumed it downstream. End-to-end, field-level lineage tracking satisfies audit requirements for SEC examinations, FINRA reviews, and MiFID II transaction reporting.
AI-Powered Anomaly Detection Reduces False Positives
Organizations using enhanced ML-based anomaly detection achieved a 94.3% reduction in false positives — from 106 false alerts to just 6 — while maintaining high detection accuracy, according to OpenSearch's research on their Random Cut Forest algorithm.
This matters enormously in financial operations. Engagement with data quality alerts drops 15% when a channel receives more than 50 alerts per week, and another 20% if alerts exceed 100 per week. Alert fatigue causes operations teams to ignore notifications entirely, creating conditions for genuine data failures to slip through undetected.
ML-based anomaly detection recognizes patterns that would trigger constant false alarms under static threshold rules, including:
- Monday morning trading volumes running 30% higher than Friday afternoons
- Month-end position file sizes spiking predictably due to additional reporting fields
- Alternative data feeds arriving with 15-minute latency variations tied to provider infrastructure load
Static rules fire alerts on all of these. ML models recognize them as normal and stay silent.
The Observability-to-Action Loop: From Detection to Resolution
Detection alone provides limited value if diagnosing root cause and routing the incident takes hours. Organizations with full-stack observability are 19% more likely to detect high-impact outages in 30 minutes or less and 18% more likely to resolve them in that same window, according to New Relic's benchmarking research. The same study found that organizations with mature observability practices reported 65% improved mean time to resolution (MTTR), with 37% lower median annual outage costs ($6.17M vs. $9.83M).
Mature observability platforms close that gap through three integrated capabilities:
- Automated root-cause analysis that isolates which upstream feed or transformation caused the issue
- Incident routing that automatically notifies the data owner responsible for the failing pipeline
- Workflow integration with Slack, Jira, and PagerDuty to ensure the right people see alerts immediately
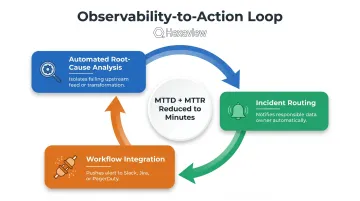
In financial markets operating 24 hours across global time zones, reducing mean time to detect (MTTD) and mean time to resolution from hours to minutes can be the difference between a minor hiccup and a material business impact.
Must-Have Capabilities for Financial-Grade Data Integration and Observability
Real-Time Pipeline Monitoring with Financial-Context Awareness
The platform must understand the temporal rhythms of financial markets—distinguishing between pre-market (4:00-9:30 a.m. ET for U.S. equities), intraday trading hours, post-market activity, and overnight settlement windows. Alert thresholds should adjust dynamically: a 10-minute feed delay at 10:00 a.m. during active trading is critical, while the same delay at 7:00 p.m. after markets close may be routine maintenance.
Key capabilities:
- Market hours-aware alerting rules that adapt thresholds based on trading session status
- Asset class-specific monitoring (equity, fixed income, derivatives, FX) recognizing unique data patterns for each
- Automated holiday calendar integration preventing false alerts on market closure days
- Cross-feed correlation analysis detecting when multiple related data sources show simultaneous anomalies
SOC 2-Certified, Security-First Architecture
Trading data, client portfolios, and position records demand controls that go beyond standard enterprise security. Integration and observability platforms must deliver:
- Encryption in transit (TLS 1.3) and at rest (AES-256)
- Role-based access control restricting who can view trading data vs. client portfolio information
- VPC deployment options for firms requiring on-premise or dedicated cloud infrastructure
- Comprehensive audit logging tracking every data access and system change
SOC 2 Type 2 certification evaluates whether controls operated effectively over 6-12 months across five Trust Service Criteria: Security (mandatory), Availability, Processing Integrity, Confidentiality, and Privacy — spanning 64 individual requirements.
For institutional clients, SOC 2 Type 2 is non-negotiable. Hexaview maintains this certification specifically to operate within highly regulated financial environments, ensuring client data handling meets institutional security standards.
Regulatory Reporting Data Quality Controls
Automated data quality checks must be embedded directly into regulatory reporting pipelines, validating completeness, accuracy, and timeliness before data reaches regulators. This includes:
- Automated reconciliation between internal books-and-records and reported positions for SEC Form PF, FINRA CAT submissions, and MiFID II transaction reports
- Error rate monitoring aligned to regulatory thresholds (FINRA Rule 6893 establishes maximum CAT error rates, with chronic failures triggering regulatory action)
- Clock synchronization validation ensuring timestamps meet regulatory precision requirements (CAT requires millisecond accuracy)
- Field-level completeness checks flagging missing required data elements before submission deadlines
SEC Rule 613 requires comprehensive tracking of every order, cancellation, modification, and trade execution for all exchange-listed equities and options, with data reported to the Consolidated Audit Trail by 8:00 a.m. Eastern the following trading day. MiFID II Article 15 and RTS 22 mandate mechanisms for identifying errors and omissions with transaction reports and correcting them promptly. Observability platforms must support these workflows natively.
Scalable, Cloud-Native Architecture Supporting Alternative Data
90% of hedge funds now use alternative data, up from 67% in 2024 and 62% in 2023. Integration layers must handle semi-structured and unstructured data at scale, including:
- Web scraping data (used by 90% of firms building custom AI models)
- Satellite imagery analyzing retail foot traffic, agricultural yields, or shipping activity
- Credit card transaction data providing real-time consumer spending signals
- Social media sentiment tracking brand perception and event-driven market reactions
- IoT sensor data from manufacturing floors, logistics networks, or energy infrastructure
Observability must extend to these non-traditional sources. That means detecting when web scraping jobs fail due to site structure changes, flagging degraded satellite image quality, or catching sentiment model drift as language patterns evolve.
Infrastructure flexibility matters just as much. Treasury Department research shows that while 90%+ of surveyed banks maintain some cloud presence, only 5% describe their usage as "mature," with most core processes still on-premises. Hybrid architectures supporting both cloud and on-premise deployments are essential for financial institutions navigating this gradual modernization.
How to Build and Implement an AI-Driven Data Stack for FinTech and Hedge Funds
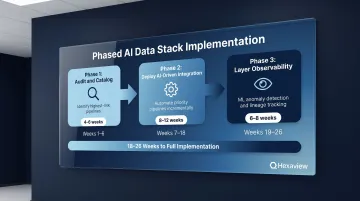
Phased Implementation Approach
Phase 1 — Audit and Catalog (4-6 weeks): Conduct a comprehensive audit of existing data sources and pipelines, identifying the highest-risk, highest-impact flows. Typically this includes real-time market data feeds, trade execution pipelines, and regulatory reporting processes. Document current state architecture, data volumes, latency requirements, and known failure modes.
Phase 2 — Deploy AI-Driven Integration (8-12 weeks): Implement AI-powered integration for priority pipelines identified in Phase 1. This is not a "rip and replace" of existing infrastructure but an incremental modernization—often running in parallel with legacy systems during validation. Focus on automating the most manual, error-prone processes first: custodian data reconciliation, alternative data ingestion, or cross-system trade matching.
Phase 3 — Layer Observability (6-8 weeks): Deploy observability across the full stack with automated monitoring, ML-based anomaly detection, and end-to-end lineage tracking. Configure alert routing, integrate with incident management workflows, and establish baseline performance metrics (data freshness SLAs, pipeline error rates, MTTD/MTTR).
Build vs. Partner: The Expertise Decision
Building this capability in-house means assembling expertise across four distinct disciplines simultaneously:
- Financial data engineering and pipeline architecture
- AI/ML model development and operationalization
- Cloud infrastructure management at scale
- Regulatory compliance frameworks (SEC, FINRA, MiFID II)
Time to hire for financial services roles averages 40-45 days, and assembling a team with all required skills can take 6-12 months — during which data problems continue accumulating.
That gap is where specialist partners add immediate value. A firm with pre-built connectors for custodians, market data vendors, and OMS/EMS platforms — and established compliance credentials — can compress that timeline to weeks. Independent research shows 328-413% ROI within three years for cloud ETL implementations, with 4-month average payback periods.
Hexaview brings 10+ years in capital markets, SOC 2 Type 2 certification, and direct experience with firms including LPL Financial and Addepar — allowing financial institutions to modernize data infrastructure without building AI and compliance competencies from scratch.
Key Success Metrics Post-Implementation
Data freshness SLA adherence: Track percentage of data feeds arriving within defined windows (e.g., 95% of market data feeds delivered within 100ms of publication, 99% of custodian files received by 6:00 a.m. daily).
Reduction in data incidents: Measure monthly data quality issues impacting downstream models or reports, targeting 60-80% reduction in first 12 months.
Mean time to detect and resolve: Monitor MTTD and MTTR for data pipeline failures, aiming for sub-30-minute detection and resolution of high-priority issues.
Analyst hours reclaimed: Quantify time previously spent on manual data validation, reconciliation, and break investigation—typically 20-40 hours per analyst per month—and track reallocation to higher-value analysis.
Audit-readiness scores: Establish metrics for regulatory submission quality, targeting zero compliance report rejections due to data quality issues within 6 months.
Frequently Asked Questions
What is AI data integration?
AI data integration uses machine learning to automate data extraction, transformation, and routing across systems. Unlike traditional rule-based ETL that breaks when source schemas change, AI-driven pipelines adapt automatically by inferring mappings and detecting format inconsistencies.
Will AI replace ETL?
AI won't fully replace ETL but is reshaping it. AI-driven pipelines automate the manual coding, schema mapping, and maintenance that made traditional ETL brittle—especially critical in dynamic financial data environments where vendor feeds change frequently.
What is data observability in financial services?
Data observability is the continuous automated monitoring of financial data pipelines for freshness, accuracy, volume, schema integrity, and lineage. It enables firms to detect and resolve data issues before they impact trading decisions, risk models, or compliance reports.
How does data observability help with regulatory compliance for hedge funds and FinTech firms?
End-to-end data lineage tracking and automated data quality controls create an auditable, traceable record of every data point used in regulatory reports. This directly supports requirements under SEC Rule 613 (Consolidated Audit Trail), FINRA Rule 4511, and MiFID II transaction reporting frameworks.
What is the difference between data monitoring and data observability?
Data monitoring is reactive: it checks predefined thresholds and alerts when they're breached. Data observability is proactive, using ML to learn normal behavior patterns, detect anomalies before they cause downstream failures, and surface automated root-cause analysis to accelerate resolution.